Over the past year, we’ve been busy transitioning our infrastructure and services to AWS Cloud. As expected, as more services were migrated, our AWS bills began to climb steadily.
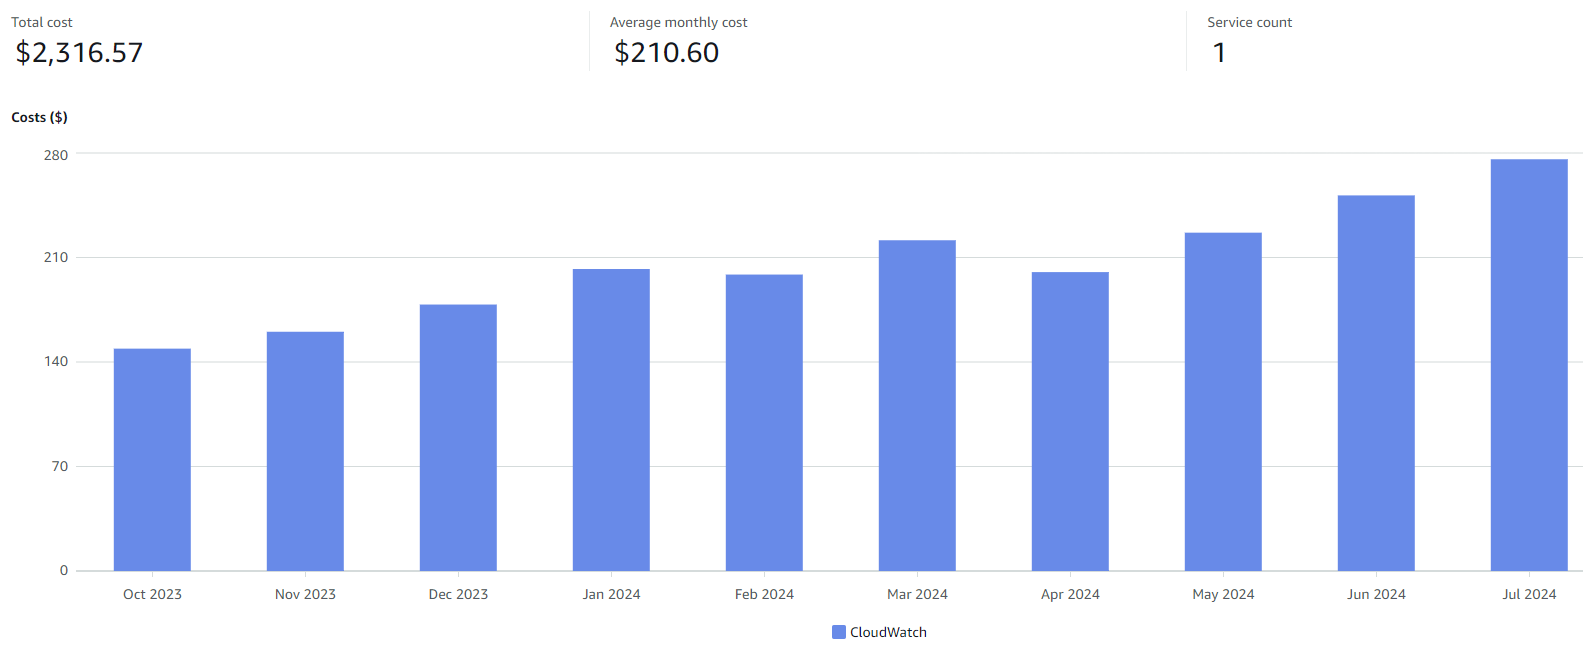
Since the start of our cloud journey, we’ve been keeping a close eye on these bills. One area that stood out was our growing AWS CloudWatch costs, which were rising every month.
The CloudWatch Cost Trap
AWS CloudWatch stores logs for all your services, so naturally, as your services increase, so do your log storage costs. For almost every AWS service, a log group is automatically created in CloudWatch, and each log group comes with a retention period. The catch? By default, the retention period is set to « never expire » meaning that data is stored indefinitely.
When we realized this, we adjusted all our log groups to retain logs for only a few days before they were deleted. I was confident this would reduce our CloudWatch bill. However, to my surprise, the costs continued to climb month after month, leaving me puzzled, especially since we forward almost all of our logs to Datadog, where we consolidate everything.
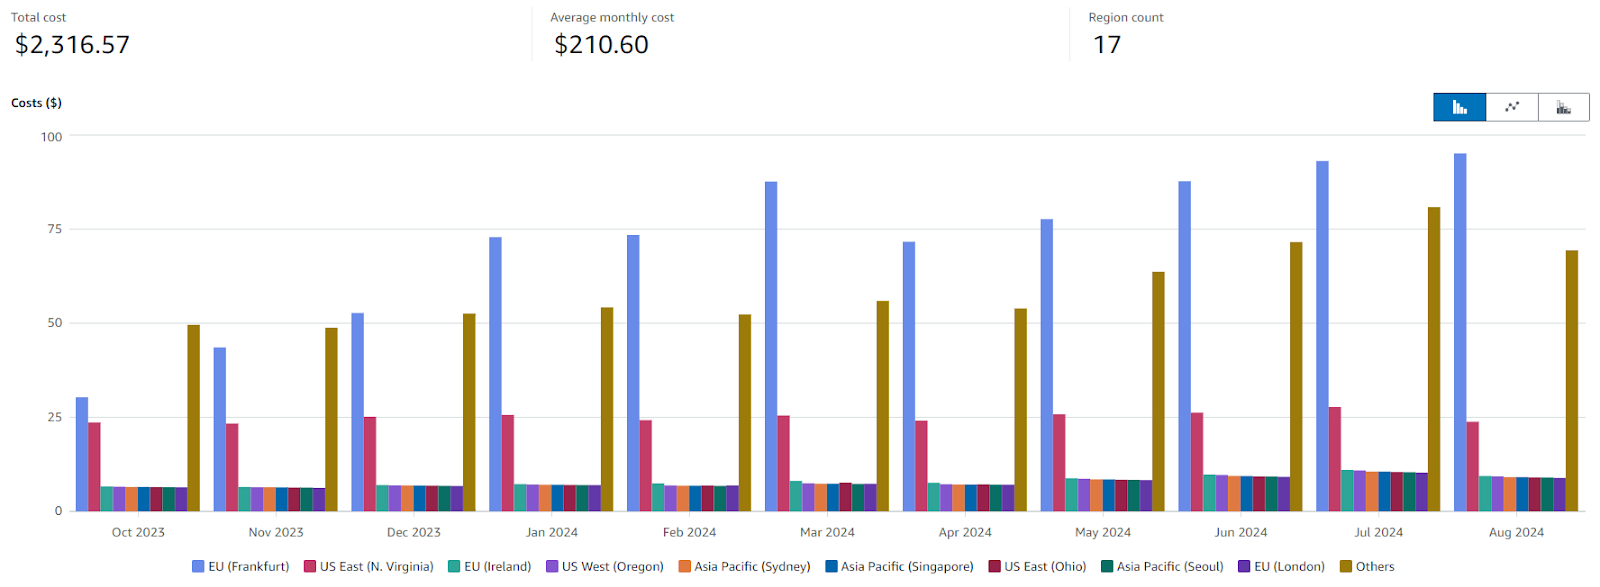
Determined to get to the bottom of this, I dove into AWS Cost Explorer to understand why our CloudWatch expenses kept growing. The first thing I did was break down the costs by region using the dimension filter. To my confusion, I noticed we were incurring CloudWatch charges across all AWS regions, despite only operating in a single region.
I manually checked several of these regions for log groups. Nothing – no log groups existed in those regions. So how were we still being charged for them? Clearly, there was more to this than just log storage.
The Culprit: Metrics API Calls
After experimenting with different filters, I discovered that over 65% of our CloudWatch costs came from an API operation called “GetMetricData.” This was a key insight – our costs weren’t just from storing logs, but from fetching metrics.
That’s when the lightbulb turned on. We have a Datadog integration with AWS, and Datadog was collecting a massive amount of data. I realized I needed to look closer at this integration.
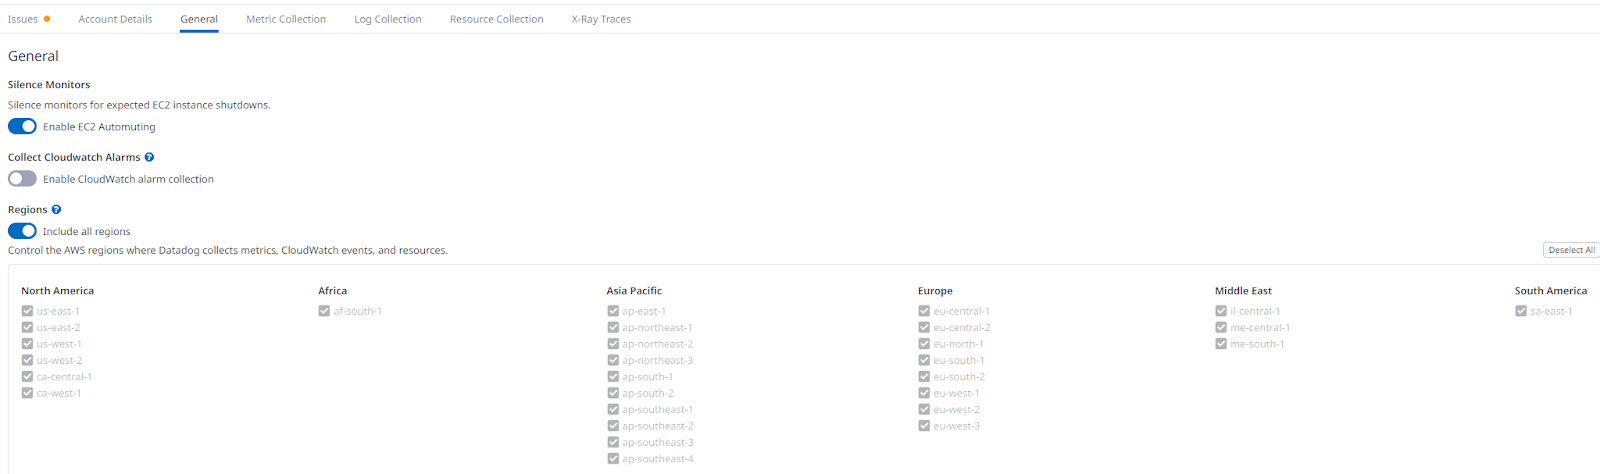
Fixing the Datadog Integration
Upon opening the AWS integration settings in Datadog and reviewing the various tabs, I found the root of the problem: by default, Datadog was configured to collect metrics from all AWS regions.
Even regions where we had no resources were generating API calls—and those calls were costing us money. In fact, we were paying between $9 and $10.50 per month for each unused region, adding up to $142 per month for absolutely nothing.
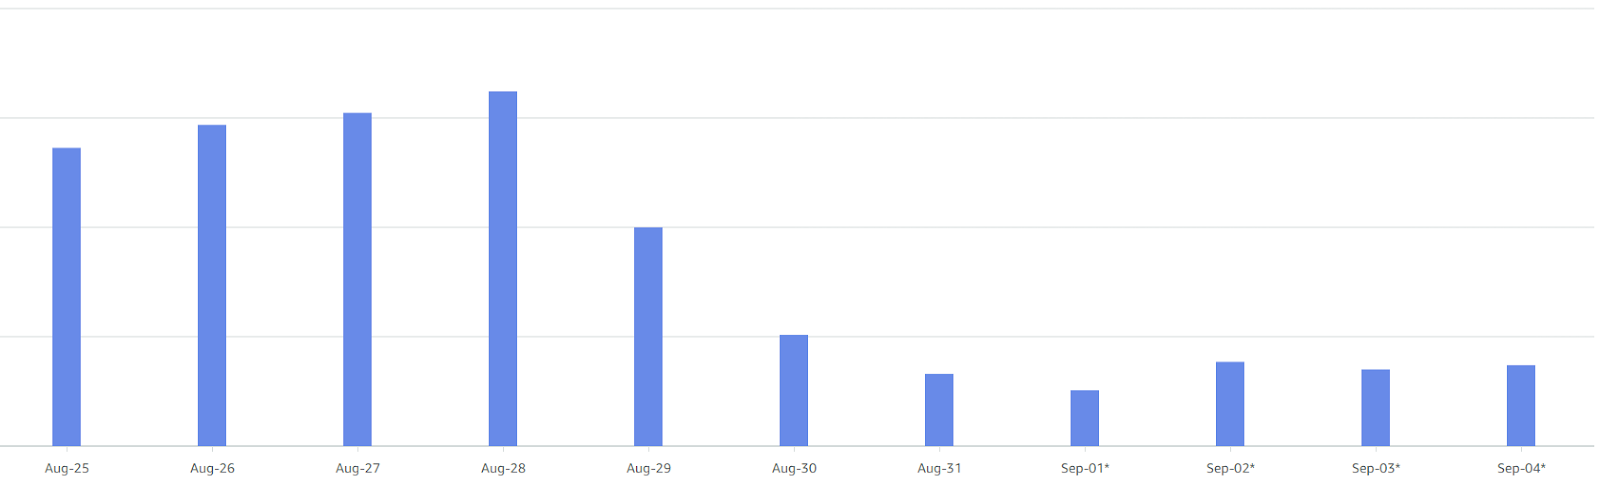
Additionally, Datadog was set to collect metrics from all AWS services, regardless of whether we actually used them. To resolve this, I disabled all unnecessary regions in the Datadog integration, keeping only the ones we actually use. I also turned off metric collection for services we don’t use in AWS. Again by default, metric collection for all services is enabled. These changes slashed our CloudWatch costs by 78%.
Feedback from Datadog
We recently had the opportunity to meet with Datadog representatives at the AWS Summit in Zürich, where we raised this issue. During our discussion, we provided feedback and shared our observations. They acknowledged that the integration’s configuration could benefit from improvement. They assured us that they would consider our feedback and discuss internally how and when they could implement enhancements. It was a productive conversation, and we appreciated the mutual exchange on this important topic.
Final Thoughts
The AWS integration in Datadog is certainly powerful, but its default settings—where all regions and services are enabled—can lead to significant, unnecessary expenses. Since there are no built-in warnings, it’s easy to fall into this cost trap without realizing it.
To avoid this, always double-check your integration configurations. Take the time to tailor them to your actual usage, and you’ll avoid wasting money on metrics and logs you don’t need.

Author
Christian Ternes
Head of Technology & Data
Finance & Insurance


